
There is no single answer to how much water does AI use. Google reported 0.26 milliliters for its median Gemini Apps text-prompt metric, based on May 2025 energy data and a fleetwide water factor. That is a dated estimate of data-center freshwater consumption. It is not a meter reading for every request, a figure for all AI, or a full supply-chain total.
How much water does AI use, and where?
AI runs on chips that draw power and give off heat. Water can enter that process at several points. The Li et al. paper groups these into three parts.
One is cooling at the site. One is the water used to make power. The third is water used to make chips and servers.
At the site, cooling moves heat away from servers and then rejects it outside. Those are separate steps. A liquid loop near a chip does not mean the liquid evaporates there. A facility may transfer that heat to a system that does consume water, such as an evaporative cooling tower. The full path matters more than the label “liquid cooling.”
Power generation can add water use away from the site. Chip and server production add another part of the footprint. Training a model and serving a trained model also have different time spans and workloads. A figure for answering text prompts does not, by itself, include the training run or the hardware supply chain.
Keep four terms separate when asking what happens to the water used by AI:
- Withdrawal: water taken into the stated system.
- Consumption: water not returned within the defined boundary, including water lost through evaporation.
- Recirculation: water used again within a loop.
- Discharge: water returned or released from the system.
Take a simple made-up case: a site draws 1,000 liters and returns 200 liters. Use the same time span and place for both counts. Consumption is 800 liters.
This is a teaching case, not a claim about the share that most sites return. Water that goes round a loop is not fresh water drawn from outside on each lap. Reuse also does not prove that no water is lost to the air.
Does AI use drinking water? Some facilities use potable supplies; others use different sources. Ask which source serves the actual site. A freshwater figure and a reclaimed-water figure should not quietly become the same category in a comparison.
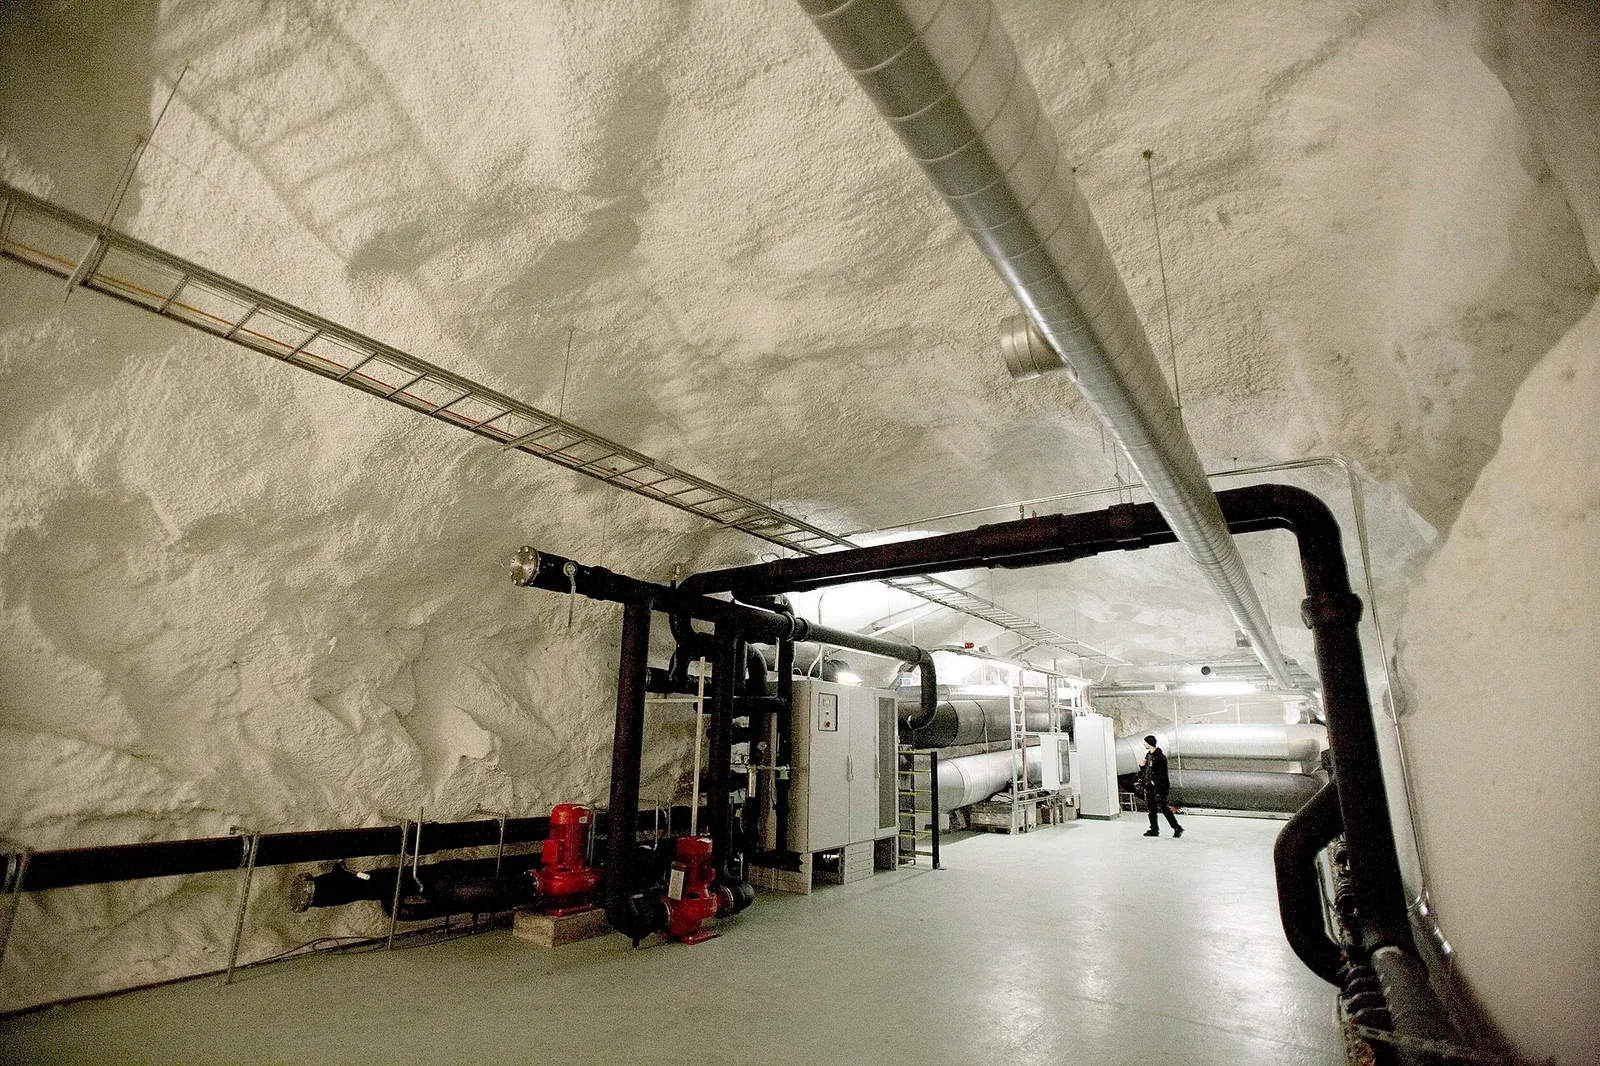
District-cooling equipment at the Academica data center in Helsinki.
What the published estimates actually measure
| Source and workload | Period or version | Reported result and method | Boundary and key limit |
|---|---|---|---|
| Google, Gemini Apps text prompts | May 2025 energy data; paper published August 21, 2025 | 0.26 mL for its median-prompt metric. Uses measured energy and a water factor. | Data-center freshwater consumption. Uses the prior year’s fleet factor, not each request’s water reading. |
| Li et al., GPT-3 conversation example | Version 5, March 26, 2025 | About 500 mL for 10–50 medium-length responses. Models energy and water use. | Cooling plus water used to make power. Place and time change the estimate. |
Google’s technical paper counts more than the chips that run the model. It includes the host CPU and memory, idle machines, and the site’s energy overhead. It then turns energy into water use with a water usage effectiveness factor, or WUE. There is no water meter on each prompt.
The word median needs care here. Google first ranks models by their average energy per prompt. It weights that ranked list by prompt counts, finds the model serving the middle prompt, and uses that model’s average energy. Water is derived from that energy metric. This differs from directly measuring water for each request and taking the middle reading.
The Google announcement says the analysis uses May 2025 data and 2024 fleetwide factors. It also states that the claims were not independently verified. Those limits belong beside the number, even when a headline needs a short answer.
Li and colleagues use an older GPT-3 example with at most 800 input words and 150–300 output words. Their assumed server energy is 0.004 kWh per request. Dividing 500 mL by 50 or 10 gives 10–50 mL per response. This only changes the units of that modeled range. It does not measure today’s ChatGPT or prove an efficiency ratio against Google’s case.
Both papers remain dated evidence. Reading them in October 2026 does not turn their inputs into current measurements. Nor can a text-prompt estimate answer how much water AI uses per image: that is a different workload.
Check the units and energy denominator
Start with the units behind the claim. Google takes overhead energy away from total energy, then applies its WUE factor. That factor is water per unit of IT energy.
It does not use all the energy drawn by the site. The energy in the sum must match the energy in the factor.
The paper’s rounded values allow a small check:
Total energy:       0.24 Wh per prompt
Overhead energy:    0.02 Wh per prompt
IT energy:         0.22 Wh = 0.00022 kWh
Water factor:      1.15 L per kWh

0.00022 kWh × 1.15 L/kWh = 0.000253 L = 0.253 mL
The paper reports 0.26 mL. Rounded inputs need not recreate a separately rounded result from the underlying data. Keep the published estimate and explain the rounding; do not “correct” the study to 0.253 mL. This check tests units and arithmetic, not Google’s meters or its model mix.
Here is a second, entirely fictional check. Assume 1 Wh of IT energy and an IT-based factor of 1 liter per kWh. The result is 1 mL.
Now substitute 1.2 Wh of facility energy while keeping that same factor. The result becomes 1.2 mL, but the calculation no longer uses the factor’s stated denominator. The added decimal places would hide a definition error.
Check the numerator too. Does the factor count water withdrawn, water consumed, freshwater only, or another supply? Are its site and year aligned with the energy data? A fleet average can support a fleet-based estimate while still being unsuitable for one site’s hottest week.
Google’s water formula does not add water used to make power or hardware. The paper also counts carbon, but the scope of that count is not the scope of its water figure. Mark the water terms left out.
Missing terms are not zero. Do not fill the gaps with an average from a different place and call it the same result.
A pipe meter measures a flow, not the water cost of each AI prompt.
Why a per-prompt number is not a total
A median is useful for describing a middle point. It generally cannot be multiplied by a request count to recover a total. Consider this deliberately uneven fictional set of five water amounts:
Amounts in mL:  0.10, 0.20, 0.26, 0.30, 10.00
Median:        0.26 mL
Sum:           10.86 mL
Mean:          2.172 mL
Median × 5:    1.30 mL
Mean × 5:      10.86 mL
This is not Google’s data. It does not recreate Google’s model-weighted method or claim that real outlier requests use 10 mL. It shows why a middle value and a total answer different questions. To estimate an aggregate, use a measured total or a suitable mean for the same set and period, with its matching count.
The same problem appears when asking how much water AI uses per year. Multiplying one published median by a guessed global prompt count does not supply that answer. The selected evidence does not establish a current worldwide AI-only total. Whole-data-center figures also include other computing work unless a method allocates them to AI.
Less water per task need not mean less water in all. For a made-up case, cut the water per task in half. Then run three times as many of those tasks. Total water use rises by half.
This is a check of the math, not a claim about growth in real demand. Both per-task use and the task count matter.
Local effects need another layer of evidence. An annual fleet figure cannot show the load on a particular water source during a dry week. Record where and when the water is used, as well as how much. Avoid treating a small average as proof of no local constraint.
A fixed gauge places a water-level reading at one specific site.
What information to ask a provider for
Turn a promising claim into a record that another person can check. Save the source URL, version, retrieval date and the quoted metric. Then fill in the fields below. Leave an unknown field visibly unknown instead of guessing from the provider’s brand or a nearby chart.
| Field | Question to resolve |
|---|---|
| Task | Which model, input length, output length and type of request? |
| Time and place | Which measurement dates, sites and electricity sources? |
| Water boundary | Cooling, electricity and hardware included or excluded? |
| Water category | Withdrawal or consumption; fresh, potable or reclaimed? |
| Energy basis | IT energy or facility energy; which overhead is counted? |
| Water factor | Where did it come from, and which year and sites does it cover? |
| Statistic | Mean, median, percentile or total; what is the matching request count? |
| Evidence | Which values were measured, derived or modeled, and who checked them? |
If a provider supplies only energy, you can record energy. You cannot claim a complete water footprint until the water factors and boundaries are supported. Likewise, a source may be strong for cooling design and weak for workload allocation. Score the evidence for the claim you need, not for every claim the source makes.
A claim check your team can repeat
Suppose a team wants to compare two tools that draft the same short reply. This is a planned check, not a test we ran. The first tool has a water figure for text prompts. The second has only a figure for all work at one data center. Put those facts side by side, but do not rank the tools yet.
One number is per prompt; the other is for a whole site.
Ask for the missing scope before you do the math. Does the first tool count all tries or only a final answer? Does the second site’s total cover AI work alone? Which year does each figure cover? If those facts are unknown, a neat chart would still rest on a guess.
Next, set a pass rule for the reply. It might need to use the supplied facts and answer the whole question. Test both tools on the same cases. Record which replies pass, which need a retry, and which need a person to fix them. That does not yet measure water, but it defines the useful work whose cost you want to compare.
Compare efficiency alongside task quality
Before you choose an AI workflow, define a useful task from start to finish. Keep its inputs and the required output the same in each test. Count retries, failed answers and any human checks within your chosen scope. A cheap half-answer is not the same result as a complete, correct answer.
Changing context length can change the task itself. Our context-rot diagnostic guide explains why matched inputs and separate quality checks matter. Use a fixed evaluation set when testing a workflow change; do not infer equal quality just because both systems produce fluent text.
Keep three results distinct: resource use per task, total resource use, and task quality. Goodhart’s law and AI metrics explains the risk of optimizing a proxy while losing sight of the real goal. A lower reported water figure is valuable evidence only for the boundary it actually covers.
Check the answer’s claims too. Low water use cannot prove that an answer is true. Our verified hallucination cases show why that needs its own review. These tests assess software. To assess a site’s water impact, you still need facts about its water source and use.
The video Calculating our AI energy consumption is Google’s own account of its method. It helps explain the energy behind the water estimate. It is not a check by an outside party. Nor does it prove the water cost of the full supply chain.
Before you share a comparison, write down the task, date, scope and type of figure. If the source cannot fill those fields, say what is missing. Then get the missing data, narrow the claim, or keep the two figures apart.